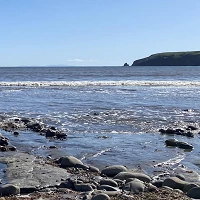
 Clarity is measured by the depth at which a 10” white disk, called a Secchi disk, remains visible when lowered beneath the water’s surface. The measurements have been taken since 1968, when the Secchi disk could be seen down to 102.4 feet.
Geoffrey Schladow, director of the UC Davis Tahoe Environmental Research Center, said it is important to remember that long-term trends are a better indication of Lake Tahoe clarity than year-to-year comparisons.
“The factors that contribute to lake clarity are complex, and are not necessarily linked to factors occurring in the current year,” said Schladow. “For example, the 2011 clarity improvement followed a winter that was one of the wettest in recent years, something that is usually associated with clarity declines. Understanding what controls the long-term trends is at the heart of what we are attempting to do.”
Researchers provided measurements for both winter (Dec.–Mar.) and summer (Jun.–Sept.) months. The winter average of 84.9 feet in 2011 was well above the worst point seen in 1997 and a 12-foot improvement over 2010.
Urban stormwater runoff has long been one contributor to reduced clarity at the lake. Most of that runoff occurs during the winter and spring, when rain and snowmelt carry small, inorganic particles from the land into the lake.
Yet despite a wet winter during 2011, clarity improved. Researchers say this could indicate that efforts led by TRPA, other management agencies, local jurisdictions and private property owners to reduce urban stormwater runoff are having an impact. However, they emphasize that they need more data on stormwater to make definitive conclusions.
Summer clarity levels continued to show a decline. The 2011 value of 51.5 feet was the second worst on record, which the UC Davis data suggest may be due to the large and late spring snowmelt, which carried enormous amounts of fine sediment and nutrients from the watersheds surrounding the lake.
“We're encouraged that lake clarity is improving and seems to be responding to the substantial restoration investments we've collectively made through the Environmental Improvement Program,” said Joanne S. Marchetta, executive director of the Tahoe Regional Planning Agency.

Clarity Readings Since 2000
• 2011: 68.9 feet (21 meters)
• 2010: 64.4 feet (19.6 meters)
• 2009: 68.1 feet (20.8 meters)
• 2008: 69.6 feet (21.2 meters)
• 2007: 70.1 feet (21.4 meters)
• 2006: 67.7 feet (20.6 meters)
• 2005: 72.4 feet (22.1 meters)
• 2004: 73.6 feet (22.4 meters)
• 2003: 71 feet (21.6 meters)
• 2002: 78 feet (23.8 meters)
• 2001: 73.6 meters (22.4 meters)
• 2000: 67.3 feet (20.5 meters)
For a complete list of Annual Secchi Depth Data since 1968, can be found here. Graphs showing the various clarity measurements for summer months, winter months, and the yearly averages, are available at the UC Davis Tahoe Environmental Research Center website.
More information about environmental factors affecting Lake Tahoe will be included in the 2012 State of the Lake Report, expected this summer.
 Live Radio


