 Live Radio
Wildfire Awareness Tools
Track real-time fire, wind, and smoke maps, stay updated on critical evacuation updates, and more—all in one place. Firecast helps you stay informed and prepared during wildfire season.
Keep trusted local coverage strong.

![]()
Sonoma County: Know Your Zone
Evacuations
The county of Sonoma lists the current evacuation orders and evacuation warnings here. You can zoom in to see more detail.
Active Fires
Wind
Wind, particularly at higher elevations, can be a powerful force in fire growth. Here are the current wind conditions and forecast. (Scroll right for subsequent days.)
Live Cameras
You can check live cameras on many North Bay mountaintops to look for fires. Click https://alertcalifornia.org/ to go to that site.
Sometimes the evacuation map will lag by a few minutes. County of Sonoma emergency announcements may show up on their social media first, check their X (twitter) account for updated information.
To directly access County of Sonoma emergency pages visit: https://socoemergency.org/
Smoke
Here's a live map of air pollution due to smoke. Green numbers are normal. Anything else is unusual. You can zoom in to your exact location.
To access this page directly: https://www.purpleair.com/map?opt=1/m/i/mAQI/a10/cC4#9.72/38.3779/-122.6859
There's also a national weather service experimental smoke forecast page here: https://hwp-viz.gsd.esrl.noaa.gov/smoke/index.html
PG&E
When fire weather is expected, PG&E may cut power. During a wildfire, many customers will usually lose power. On this map you can see current outages.
To access the PG&E outage maps directly: https://pgealerts.alerts.pge.com/outages/map/
911 Calls
911 fire calls could indicate a problem before satellites can see it. Below are the active fire and medical 911 calls in Sonoma County. Note you can also see these calls displayed in "map view."
You can click https://www.broadcastify.com/listen/ctid/231 to listen to 911 dispatch. Don't trust everything you hear: first reports are often inaccurate.
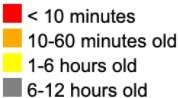
Heat Map GOES-17
Above is a fresh image from the fastest but least accurate satellite heat detection system, called GOES-17. Compare the timestamp on the map to the current time: this image should be less than six minutes old. You can reposition the map and zoom in and out. Hot spots are detected where you see colored rectangles. Each rectangle is roughly 2 Km x 2 Km (1.25 x 1.25 mi). This does not reliably show you boundaries for a given fire, but it tells you there's probably fire or smoke somewhere inside that area. The color of the rectangle indicates how old the report is:
MODIS and VIIRS are different satellites that are more accurate, with a visual resolution of .6 miles and .22 miles, respectively. Inside that range, they cannot further differentiate where heat/smoke are. These satellites only pass overhead once or twice per day.
Hot spots appear as asterisks. Here again, colors indicate the age of the hot spot report:
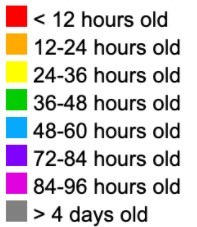
You can zoom in to see more information like the time of the flyover and the measured ground temperature associated with each hotspot.
Access both of these maps directly at https://caltopo.com/map.html#ll=38.18207,-122.64862&z=8&b=om
Lightning Strikes
Known Fire Starts
Click here to see known fire starts, as identified by GIS professionals from emergency agencies and social media.
NWS Advisories
KRCB 104.9 FM Sonoma County's NPR Station
When major weather developments happen, we’ll provide updates on our radio station KRCB 104.9 FM - find us streaming live at krcb.org.

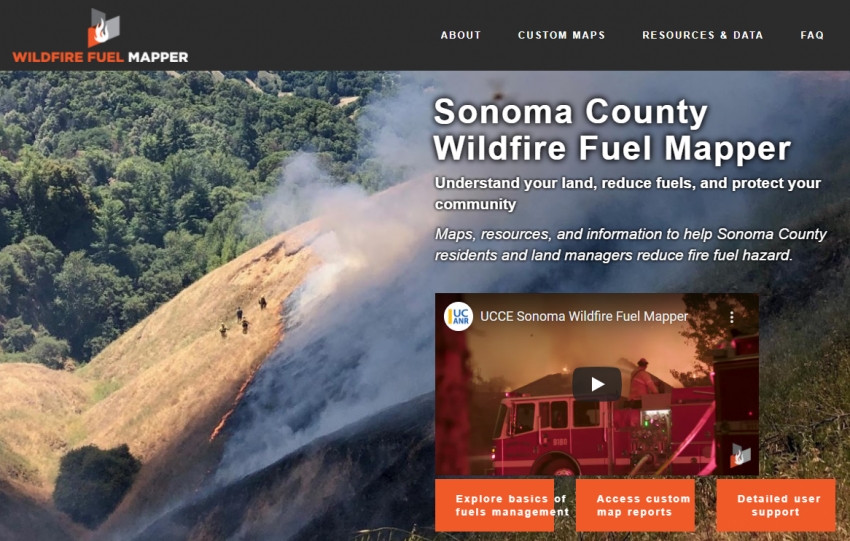
Wildfire Fuel Mapper
________________________________________________________
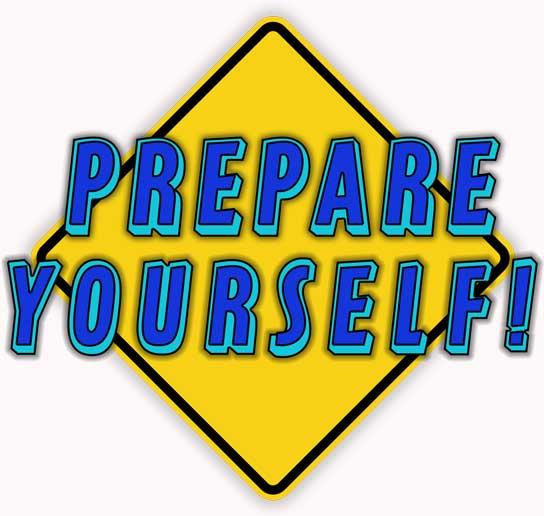 NorCal Public Media’s Original series “Prepare Yourself!” takes a unique approach to disaster preparation, with clever satire, entertaining skits, and original music. Our hosts guide you through memorable moments that have fun, yet relay important information about home emergency kits, go-bag readiness, property protection, and how neighbors and communities can help each other during emergencies and evacuations.